Scatter plot of observed vs expected weighted co-mutation
Source:R/selectX_plot.R
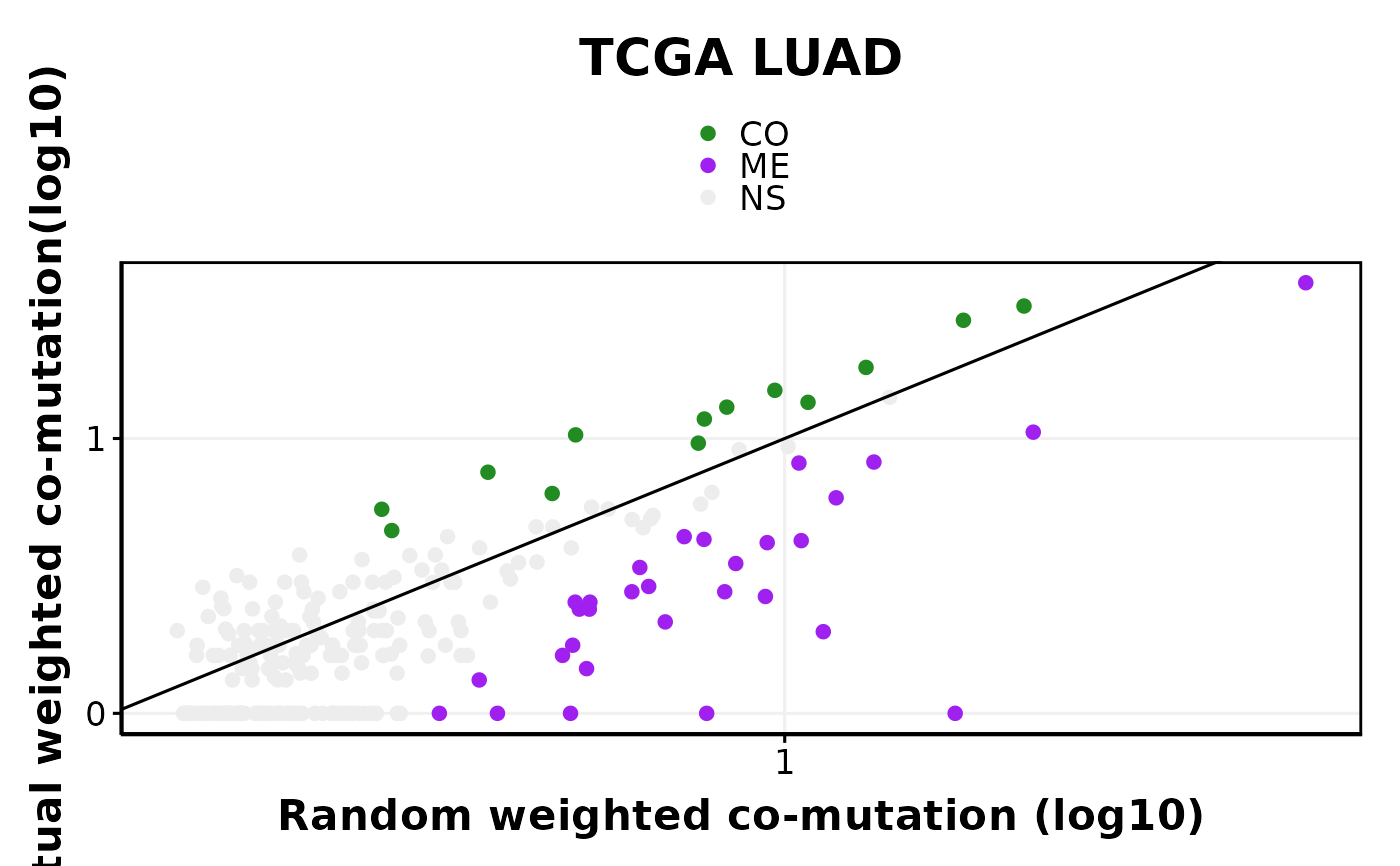
obs_exp_scatter.RdPlots each gene pair as a point with observed weighted co-mutation on the y-axis and expected (null model mean) on the x-axis. Significant co-mutations (CO) and mutual exclusivities (ME) are coloured; non-significant pairs are grey.
Examples
# \donttest{
data(luad_result, package = "SelectSim")
obs_exp_scatter(result = luad_result, title = "TCGA LUAD")

# }
# }